Important metrics to measure effective call management at a call center are both its qualitative and quantitative measures. Here, there are the quantitative ones. The call center performance metrics that need to be measured for a call-center for quantitative metrics, and for a better understanding of the KPIs of call center from a numbers metric point of view along with the benefits of each metric, what they measure, how to improve them, and effect of improvisation on these metrics.
Mainly, the measured KPIs, KRAs of call centers revolve around call hold time, call talk time, and queue time. Along with these other important granular metrics have also been mentioned like average speed to answer a call, the average speed of handling a call, cost per contact (for inbound call centers).
Thus, the metrics optimization take away’s are the gist of this whole article which I hope all the managers and call center staff would efficiently improve their workflow to maximize the customer experience, RoI of the call center.
Call Center Performance Metrics :
Basic call center metrics: when analyzed using specialized call center software, offer an overview reporting which provides a macroscopic idea of the call duration time, call holding time, and call talk time to evaluate the effort invested towards the consolidated call center structure.”
- IVR time : Total time spent by the customer under the IVR umbrella and its services before coming in contact with an agent.
- Queue time : Time spent between the IVR & the agent , this oblivion from the customer’s end is explained by the queue time. This metric indicates both
- Call Hold Time :Time spent on hold after getting connected to the agent , here the time on hold should be generally minimal so that the customer doesn’t feel deprioritized and call hold should be used only when necessary and notifying the customer of the same with appropriate reason.
- Call Talk Time : Total time spent in the conversation of the customer and the agent can be termed as the consolidated call talk time , mostly the conversation should have a quick & satisfactory reply so that agents could be more productive.

Advanced Performance Metrics: For granular details of each and every rupee spent in your call center supported with an advanced IVR system that helps in measuring the overall call center RoI, customer success & agent reporting.
- “Zero Out” Rate
- Average Handling Time (AHT)
- Cost per Contact
- Average Speed of Answer (ASA) :
- Customer Effort Score
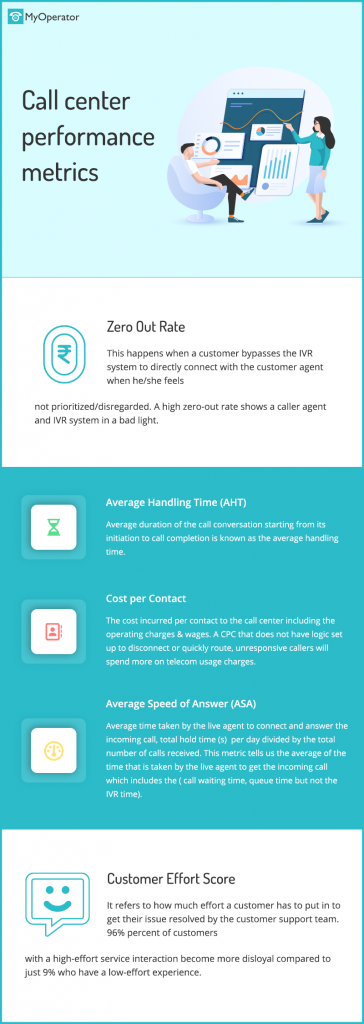
1. Zero Out Rate
This happens when a customer bypasses the IVR system to directly connect with the customer agent when he/she feels not prioritized/disregarded.
A high zero out rate shows caller agents and IVR number in a bad light, this needs to be improved by providing relevant options in the menu and having prompt answers to the frequently asked questions of the user so that the user uses the IVR for its reliability and service and not simply skip the same for a human response.
The benefits of lowering the zero out rate to an acceptable level would help the customers to
Reason: Mostly customer’s bypass the IVR menu and zero out due to an increased level of frustration
Counter Measures
A thorough look back into the IVR options and the call flow design along with the various prompts in between the call pathway of customers should be a start.
- Redesign the main menu with right organisational silos and cross-functional customer overview : this can be explained in simple manner of distributing the most important departments which receive the customer calls and then add multi-level sections behind them so that easily new customer can surf and get to the desired dept irrespective of of his requirement .
- The look back into the queries that have resulted in zero out and then adding resolutions for the same in the back of the right category . Thus outcome would be a positive effect and lower zeroed out call of customers as most of their queries are resolved itself and the main menu which needed agent but still agent is an important asset for more complicated , manual intervention tasks.

The main motive is to require minimum input of options from the customer’s end and faster query resolution even if it requires agent conversation but after the right amount of input is given in order to understand the concern in minimum time.
2. Average Handling Time (AHT)
The average duration of the call conversation starting from its initiation to call completion is known as the average handling time.
Industry Standard: AHT Industry Standard – 6 minutes and 3 seconds (based on 190,702 entries into our Erlang Calculator)
A Cornell University report made this point clear when comparing the AHTs of different types of contact centers. The results can be found in the table below.
| Business Sector | Average Handling Time (seconds ) |
| Financial Services | 282 |
| Business and IT Services | 282 |
| Retail | 324 |
| Telecommunications | 528 |
Calculating Average Handle Time
- Talk Time: The time during the call spent with the live agent until the resolution of the problem is obtained
- Hold Time: The time spent by the customer on hold during the call (after the call is connected)
- After call time: The time spent by the agent to fill up the CRM, paperwork, and task-related to the call center
- Talk time + Hold time + After Call time / Number of calls = AHT
- A high AHT indicates an issue with IVR, agent, etc
Benefits
- AAA System : Acknowledge ask and answer Acknowledge the problem/query of the user and then ask the right questions regarding the same , finally answer with apt answers / actions from your side for the resolution of the query
- Agent Feedback : Customer feedback is not the only factor that helps improve the call centre metrics but also the agent feedback , as they are the one handling the class day in and day out which will help us uncover the problems they face regarding the longer handling time and the subsequent reason for its increase and options for its decrease.
- Don’t be desperate : we need not be in a dictator hup mindset to reduce the handling time , deliberately doing the same will only result in decreased satisfaction in the customers .
- Route to experts : Better FCQ , Lower AHT (Average handling time ), Lower CPC.(Cost per contact )
- Customer centric website : The website is one of the most [preferred touchpoints of customers because many millennials prefer to have self service . If we provide a detailed knowledge base with frequently asked questions and appropriate answers on our website it will also reduce the customer trouble to call , reducing call volume , AHT & increased customer satisfaction.
- Eliminate redundancy : Like any other technology we have to make our IVR and call centre updated with the latest menu options that are relevant as we;ll as useful for query resolution .

3. Cost per Contact
The cost incurred per contact to the call center including the operating charges & wages. This might not be difficult to calculate if we take the operational cost and wages then divide the number of business contacts. But in order to get a microscopic view, we might need to dwell further.
A CPC that does not have logic set up to disconnect or quickly route, unresponsive callers will spend more on telecom usage charges.
Counter Measures
- Have customer data handy : Here , we need to understand the importance of keeping the customer data for easy and fast access , more efficient the data pulling process the faster will be the resolution provided to the caller.
- Attach a callback feature in IVR : It’s not always that the call can be routed quickly to the live agents , in peak times of call volume or long duration wait time , we can add a prompt in the queue tone which helps the caller to get a call back later. This way we can reduce the call hold time and call queue time of the callers.
- Use skill based routing : Skill based routing is in itself self explanatory , that the call should be routed to the department that is adept to handle the calls with that particular concern . Then only we can expect better FCQ lowered and lower AHT.
- Have self service options (Do it Right) : There is no better service to the customer than self service if and only if we can make it convenient for them . Implementing it just for the sake of it won’t do. Providing frequently occurring problems and their best possible resolutions in the initial call on the main menu will help for self service along with lowering the CPC , increasing the Csat.
Average Speed of Answer (ASA)
The average time taken by the live agent to connect and answer the incoming call, total hold time (s) per day divided by the total number of calls received. Its importance is such that it is strictly mentioned in the SLA (service level agreements ) for an outsourced call center.
Simply put, this metric tells us the average of the time that is taken by the live agent to get the incoming call which includes the ( call waiting time, queue time but not the IVR time ).
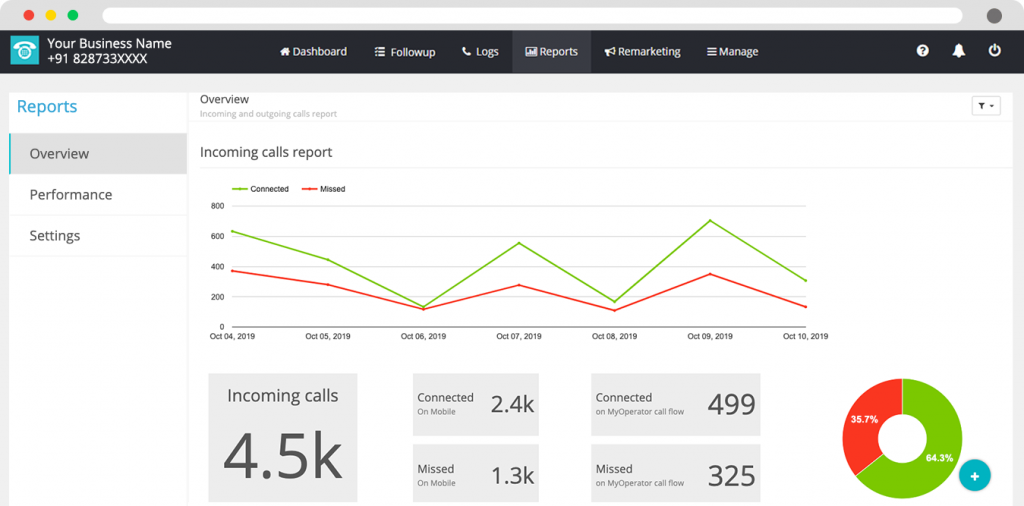
Formula to calculate call center ASA :
total waiting time of for answered calls*/total number of answered calls
(this waiting time only includes queue time and hold time, not the IVR surf time )
Industry-standard of ASA :
- 28 seconds is the global average of ASA
- 80% (roughly ) of calls are answered within 20 sec
Pitfalls
ASA is an important metric and there are some pitfalls that need to be covered in the outlier analysis for appropriate measurement of the call center ASA.
- That is if the calls answered have an average ASA of 20 sec for the whole day then we seem to be assured that it is going fine but granular analysis sometimes uncovers that the lunch duration of the ASA is 2 minutes and rest of the time it is lower . Thus the management needs to be informed about the metric in a detailed time divided manner to analyse sudden increase or decrease.
- Secondly , there is a concern which rises that abandoned phone calls , if the phone call is abandoned then it will not reflect in this ASA metric as we take the total number of answered calls in the numerator .

Benefits :
- Low abandonment rates : the calls of customers which are answered quickly are less likely to to abandon their call
- Good First call resolution : If the caller receives the call and gets their initial (first) query resolved quickly as the average call handling time is less
- Decreased handle time : The customers that are frustrated , angry due to the long wait times require the agent to profusely apologize for the same and thus taking much longer time than the case if they would have got onto the live agent earlier ( with no damage to the the brand image , frustration of customer ) .
- Decreased in escalated calls : Escalation happens when mostly there is something wrong on the caller’s interaction with the call centre , here the call hold/queue time was longer than the expected so escalation / calls getting to managers/team leaders will not only make the system inefficient but also increased dissatisfaction in the call center management . By implementing an efficient cloud call center solution, you can minimize such escalations and improve overall customer satisfaction.
- Increased Customer satisfaction : The factor that every company strives to achieve can be catastrophically damaged with high average handle times. Average handle time
- Enhanced Agent Productivity : If the average call answer times is kept to the lower end of 20 sec or less
4. Customer Effort Score
Ninety-six percent of customers with a high-effort service interaction become more disloyal compared to just 9% who have a low-effort experience, according to Gartner .
Benefits
- Personalisation : Adding menu as per the contact saved in the CMS would save a lot of time as the menu would offer the options required to them in its layout , frequent call finished
- Help with omnichannel presence: The omnichannel presence across the web , social media channels and WhatsApp API needs to be encashed by the company and make the users informed about its knowledge base ,frequently asked queries thus reducing the inbound call volume and maximising self service of customers as well as the Csat (customer satisfaction) Additionally, providing a toll-free number for customer inquiries can further enhance the overall customer experience.
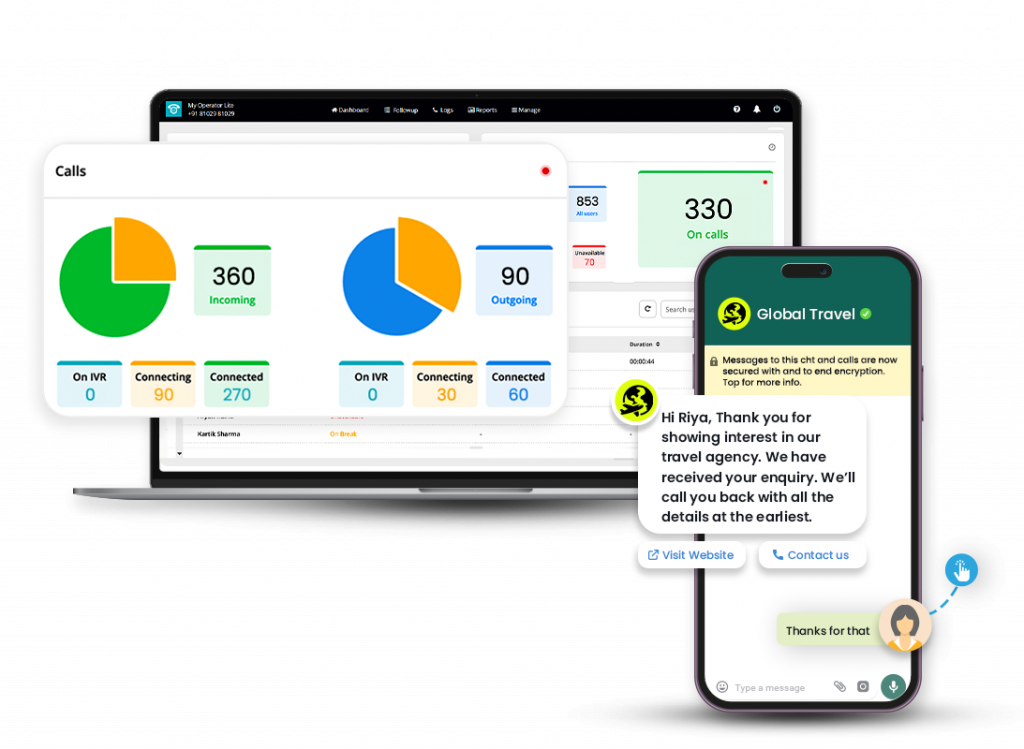
- Agent and customer feedback :Customer feedback along with the agent feedback would guarantee a lethal potion which if poured into the cross perspective view would offer the best optimisation points
- Resolving ASA , FCQ : Average speed of answer & first contact resolution are the two most significant metrics that affect Csat and thus the call centre which needs to be kept in a good position .
For example, Ram calls a call center and the call is picked up by an agent with high service proficiency, then he gets his transaction/query resolved quickly. Now due to quick resolution, another caller queue time is lowered. Thus, improving both FCQ and ASA and amplifying the Csat.
Conclusion: Call center performance Metrics are something that can be measured and thus can be improved, here all the call center performance metrics discussed and their viability and scope of optimization were discussed. Takeaways in the counter-measures, scope of improvement in the industry statistics were provided.

